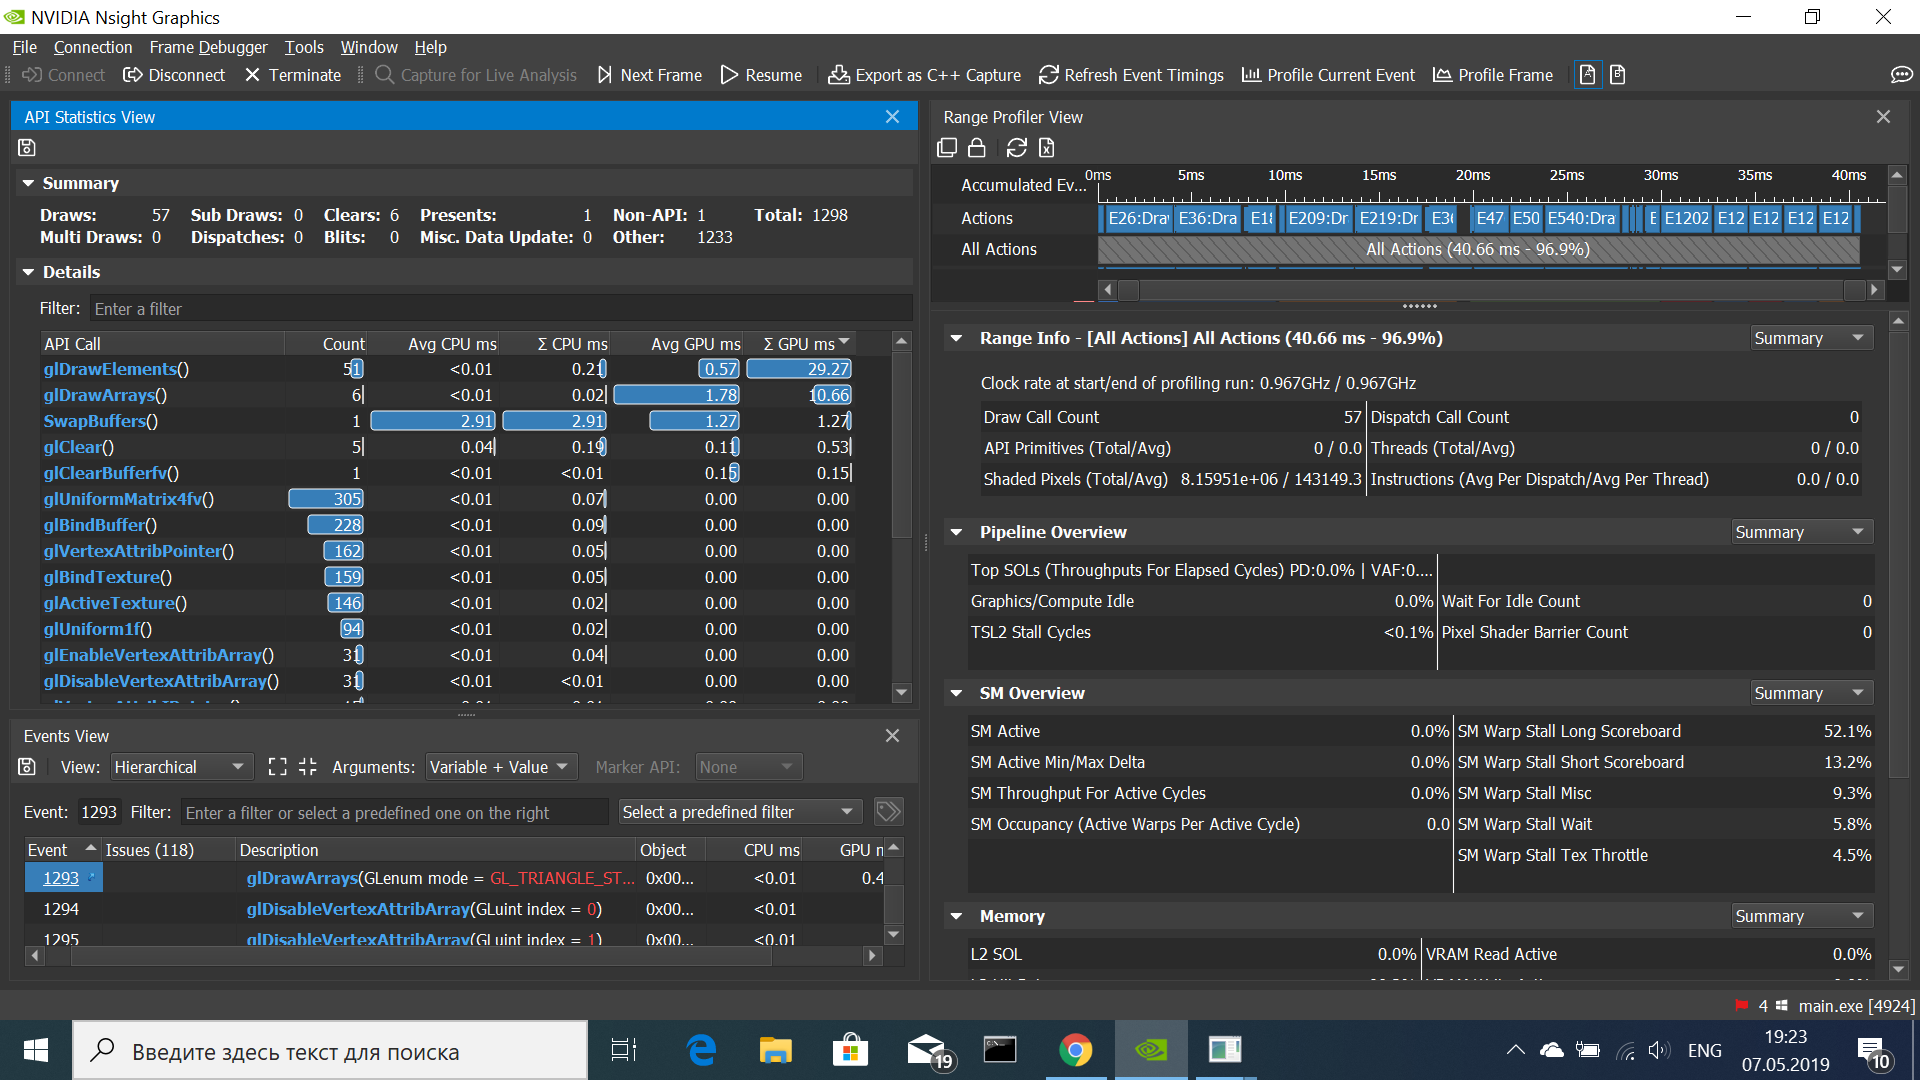
Here some data from NV Nsight Graphics
Spoiler
.png.9e86cddc2c0d2e9dc6372f65109ad84d.png)


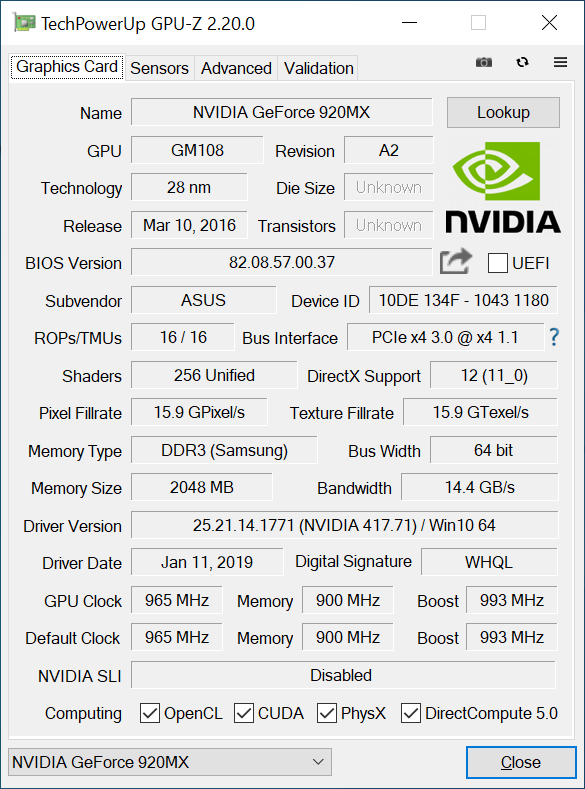
I decided to conduct an experiment, and created a similar scene in Unity. I did it quickly, so the materials are not exactly the ones that were used in the OpenGL scene (I didn't load all textures in Unity, for example). And I got ~30 FPS with the same models, without animations and without post-processing what I did (bloom, dof, ssr etc). So most likely the problem is in my video card... Here is a little about my NVGF 920mx. Here is a screenshot from the GPU-Z:
And here are the results of my experiment:
.png.cec8292a1495551a9eba7a59177af71a.png)
.png.5435642ed6685e15332c048952ac28af.png)
Here are benchmarks results:
.png.98c897cb672c39518624fec3c721a7ed.png)
.png.a70b239cda06f0b901d8967364bf2790.png)
I also launched glxgears, it showed ~200FPS
Is the whole problem in my video card?
I am not a hardware expert, but a Geforce of the 900 series should easily handle this scene.
Are you using a laptop? If you have an onboard GPU, then maybe your program is just using the onboard chip instead of your GeForce. I had a similar problem a long time ago. You should open the Nvidia control panel, search for your executable and enforce hardware acceleration.
If that's not the problem, I have no clue at the moment.
Greetings.
26 minutes ago, DerTroll said:Are you using a laptop? If you have an onboard GPU, then maybe your program is just using the onboard chip instead of your GeForce
Yes, I'm using a laptop Asus x302uv-r4023d. And the application runs exactly on GeForce

There are several things to take into account:
Based on the information you have provided it (in particular the NSight screenshots) there are a lot of texture stalls, based on the SM Throughput For Active Cycles being low, combined with the SM Warp Stall Long Scoreboard being relatively high. You can read more about this here (https://devblogs.nvidia.com/the-peak-performance-analysis-method-for-optimizing-any-gpu-workload/, in particular the Example 3: TEX-Latency Limited Workload)
Digging through your capture for RenderDoc (which I couldn't open in RenderDoc 1.4 nor 1.3, so I just dug throught the XML) it seems like you're creating reasonably sized textures with uncompressed formats that are not mipmapped (I see a 512x512 GL_RGB, 1000x1000 GL_RGB, 1024x1024 GL_RGB, etc) (Note that because I cannot open the capture I can't easily tell if there is another thing going on where mipmaps are created of this texture, but it is worth looking at)
You could try setting 1x1 textures in NSight and you should see framerate go up. If so, make sure the textures are mipmapped. More ideally for the textures you are using DXT1.
Also it seems from the screenshot that you have some sort of Depth of Field going on. From the same capture it seems like you're using a frame buffer of 1366x763 of half float format (GL_RGB16F). If you are using this for the DoF that would cost a lot of texture bandwidth. I would imagine the down sample is somewhere in your NSight capture around 30ms and if so, that looks expensive at first glance.
I hope this helps
------------
Speculation on my part, but based on:
Quote128x128 window: 44 (43.7657) FPS, 22.849 ms
256x256 window: 42 (40.9563) FPS, 24.4162 ms
512x512 window: 35 (34.8007) FPS, 28.7351 ms
1024x1024 window: 22 (21.084) FPS, 47.4293 ms
And:
Quote1024x1024: 25 (24.1861) FPS, 41.346 ms
2048x2048: 24 (23.239) FPS, 43.0311 ms
It could be that at low resolutions less fragments are needed, so it uses less memory bandwidth. At 1024x1024 and 2048x2048 window sizes, multiple fragments could be using the same texture sample and hence performance doesn't deteriorate drastically with higher resolutions.
Again... this is speculation.
Can you try comment the code in main, and return a simple color in the Fragment Shader, and send us the bench?
Computer Graphics programmer.
Did you ever figure out what was wrong? Would be nice to know what it ended up being.
On 5/31/2019 at 7:13 PM, Lord Fers said:Can you try comment the code in main, and return a simple color in the Fragment Shader, and send us the bench?
FPS increased to ~52 if I fill the whole scene with one color
FPS increased to ~49 if I fill the whole scene with color from texture
11 hours ago, deadc0deh said:Did you ever figure out what was wrong? Would be nice to know what it ended up being.
I am of the opinion that the whole problem is in my video card. I did the optimization: I divided some shaders, for rendering into smaller textures, I moved the call of some functions from the main loop, replaced one point light source with directional light. In connection with the obtained performance, I increased the blur kernel radius for Bloom from 8 to 15. And in the end, I got 36-38 FPS
5 hours ago, congard said:FPS aumentado a ~ 52 si completo toda la escena con un color
FPS aumentado a ~ 49 si lleno toda la escena con color de textura
Soy de la opinión de que todo el problema está en mi tarjeta de video. Hice la optimización: dividí algunos sombreadores, para renderizar en texturas más pequeñas, moví la llamada de algunas funciones del bucle principal, reemplazé la fuente de luz de un punto con luz direccional. En relación con el rendimiento obtenido, aumenté el radio del núcleo difuminado para Bloom de 8 a 15. Y al final, obtuve 36-38 FPS
Could you test how many FPS you get with an OpenGL window without drawing anything, just call to clear? And then try the same, if you know, but with Direct3D. With that comparison, you could know if it's the driver, or if it's the GPU itself.
Greetings.
Computer Graphics programmer.