Advertisement

Trying to finding bottlenecks in my renderer

Started by December 07, 2017 07:55 AM
37 comments, last by Matias Goldberg 7 years, 1 month ago
11 hours ago, noodleBowl said:

The 40ms time is just the cost of doing the render, so this is just the Draw and unmap/map calls. When I time this function I'm doing it like so:

<wall of code>

Am I understanding this correctly: your renderList contains 10,000 sprites and you Map() > memcpy() > Unmap() each one individually? No wonder you're having issues. It should be a single Map() > memcpy() > Unmap() call.

14 hours ago, noodleBowl said:

So I don't think this is exactly what you mean, but speaking from a map/unmap stand point if I move things around and only map once per draw call my time goes down to 25ms. To do this I created an intermediate array that is the same size as my vertex buffer. Then I place my sprite data into this intermediate array, when I need to draw I just do a memcpy straight into the vertex buffer 

This is a much better way of doing things rather than mapping and unmapping 10,000 times.  But 25ms still seems to much for what you're doing.

14 hours ago, noodleBowl said:

Currently my SpriteVertex class is using a float3 for the position on the CPU side.

Are you creating 10,000 * 6 sprite vertex's per frame invidually?  Or up front?  60,000 dynamic memory allocations a frame might slow you down especially on a laptop CPU.

What does flushvertexbuffer do exactly?


-potential energy is easily made kinetic-

Advertisement
13 hours ago, Michael Aganier said:

Knowing the usage of the rendering thread is important because If it is at 100%, it means that the GPU is waiting for more instructions because you're not sending them fast enough or in a such a way that the GPU can parallelize them. If this is the case, you have a 100% confirmation that the problem is your renderer.

So I'm not sure if I did this right but I went back and looked my CPU with the graph set to show logical processors

cpuScreen.PNG.24020bc4300b7b9d9e9253d72abd3c3b.PNG

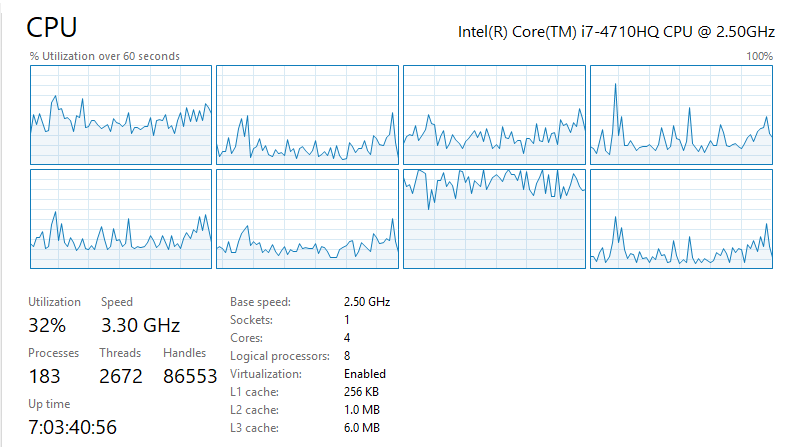
Based on this it looks like my CPU is crunching hard

12 hours ago, matt77hias said:

BTW if you use Visual Studio, you can use the built-in profiler. This will give you a rough idea of the methods taking most of the time. Furthermore, they do not use your timer. So you can rule out the issues you think to have with your timer.

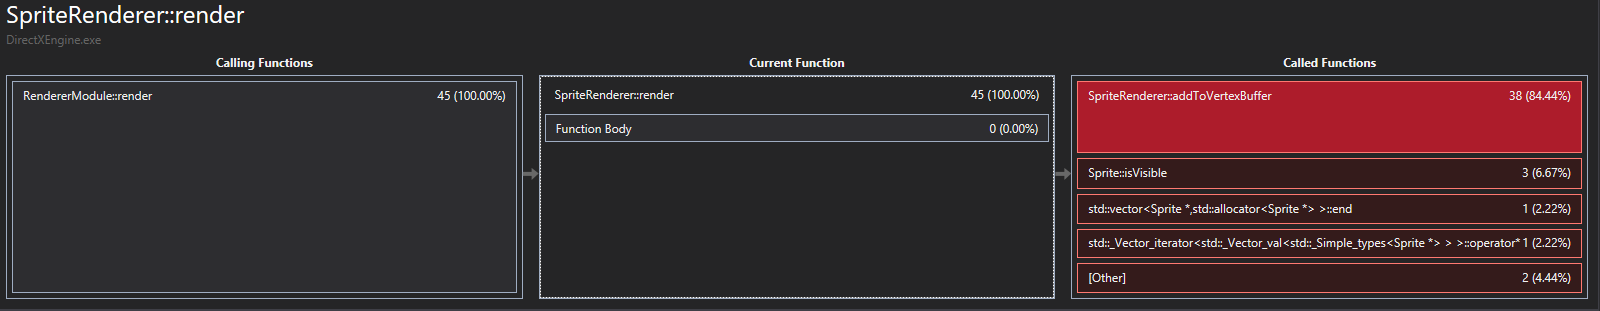
Didn't know this was a thing. This is awesome. I feel like this confirms its my CPU. I'm not sure if I can set it to look at one run of a function or not but I set the "look at" frame as small as I can. Which is about 44ms

perfRender.thumb.PNG.41993efbbdc93d16835562f1e62dba11.PNG

perfAddVert.thumb.PNG.acee99493cdd45afa776f059d5723fbf.PNG

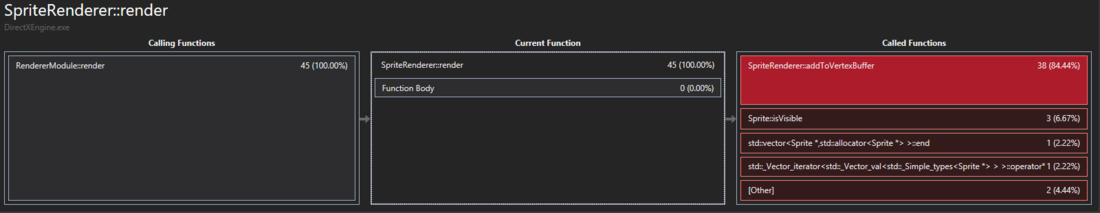
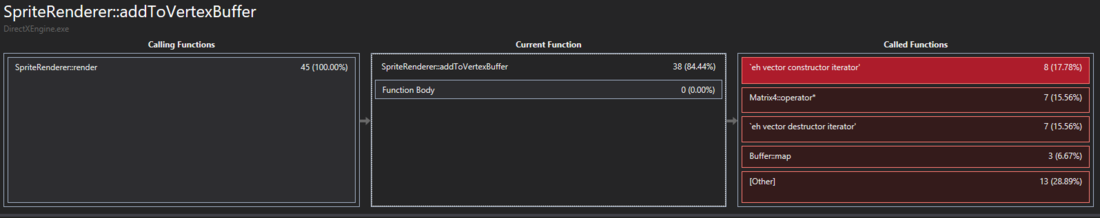
Looking at this a hugh chunk of time is spent in the addVertexToBuffer method. Which makes sense since this method is ran once per sprite. This method basically sets up the sprite, in here we are doing things like setting positions for the vertices, checking what tex coords to map, and etc. Honestly I don't know if this is the right place for this. I feel like the code in here might be better suited in the actual sprite class inset of having to redo it every frame for each sprite. Moving it to the Sprite class itself this stuff could be "precomputed" and the addToVertexBuffer would just be a data copy method


void SpriteRenderer::addToVertexBuffer(Sprite* sprite)
{
	Texture* spriteTexture = sprite->getTexture();
	if (spriteTexture != boundTexture)
	{
		flushVertexBuffer();
		bindTexture(spriteTexture);
	}

	if (vertexCountInBuffer == MAX_VERTEX_COUNT_FOR_BUFFER)
	{
		flushVertexBuffer();
		vertexCountInBuffer = 0;
		vertexCountDrawnOffset = 0;
		vertexBufferMapType = D3D11_MAP_WRITE_DISCARD;
	}

	float width;
	float height;
	float u = 0.0f;
	float v = 0.0f;
	float uWidth = 1.0f;
	float vHeight = 1.0f;
	float textureWidth = (float)spriteTexture->getWidth();
	float textureHeight = (float)spriteTexture->getHeight();
	SpriteVertex verts[6];

	Rect* rect = sprite->getTextureClippingRectangle();
	if (rect == nullptr)
	{
		width = textureWidth / 2.0f;
		height = textureHeight / 2.0f;
	}
	else
	{
		width = rect->width / 2.0f;
		height = rect->height / 2.0f;

		u = rect->x / textureWidth;
		v = rect->y / textureHeight;
		uWidth = (rect->x + rect->width) / textureWidth;
		vHeight = (rect->y + rect->height) / textureHeight;
	}
	verts[0].position.setXYZ(-width, -height, 0.0f);
	verts[1].position.setXYZ(width, height, 0.0f);
	verts[2].position.setXYZ(width, -height, 0.0f);
	verts[3].position.setXYZ(-width, -height, 0.0f);
	verts[4].position.setXYZ(-width, height, 0.0f);
	verts[5].position.setXYZ(width, height, 0.0f);

	if (sprite->isFlipped() == false)
	{
		verts[0].texCoords.setXY(u, vHeight);
		verts[1].texCoords.setXY(uWidth, v);
		verts[2].texCoords.setXY(uWidth, vHeight);
		verts[3].texCoords.setXY(u, vHeight);
		verts[4].texCoords.setXY(u, v);
		verts[5].texCoords.setXY(uWidth, v);
	}
	else
	{
		verts[0].texCoords.setXY(uWidth, vHeight);
		verts[1].texCoords.setXY(u, v);
		verts[2].texCoords.setXY(u, vHeight);
		verts[3].texCoords.setXY(uWidth, vHeight);
		verts[4].texCoords.setXY(uWidth, v);
		verts[5].texCoords.setXY(u, v);
	}

	verts[0].color.setRGB(0.0f, 0.0f, 0.0f);
	verts[1].color.setRGB(0.0f, 0.0f, 0.0f);
	verts[2].color.setRGB(0.0f, 0.0f, 0.0f);
	verts[3].color.setRGB(0.0f, 0.0f, 0.0f);
	verts[4].color.setRGB(0.0f, 0.0f, 0.0f);
	verts[5].color.setRGB(0.0f, 0.0f, 0.0f);

	//Pre transform the positions
	Matrix4 model = sprite->getModelMatrix();
	verts[0].position = model * verts[0].position;
	verts[1].position = model * verts[1].position;
	verts[2].position = model * verts[2].position;
	verts[3].position = model * verts[3].position;
	verts[4].position = model * verts[4].position;
	verts[5].position = model * verts[5].position;

	D3D11_MAPPED_SUBRESOURCE resource = vertexBuffer->map(vertexBufferMapType);
	memcpy(((SpriteVertex*)resource.pData) + vertexCountInBuffer, verts, BYTES_PER_SPRITE);
	vertexBuffer->unmap();
  
	vertexCountToDraw += VERTEX_PER_QUAD;
	vertexCountInBuffer += VERTEX_PER_QUAD;
	vertexBufferMapType = D3D11_MAP_WRITE_NO_OVERWRITE;
}

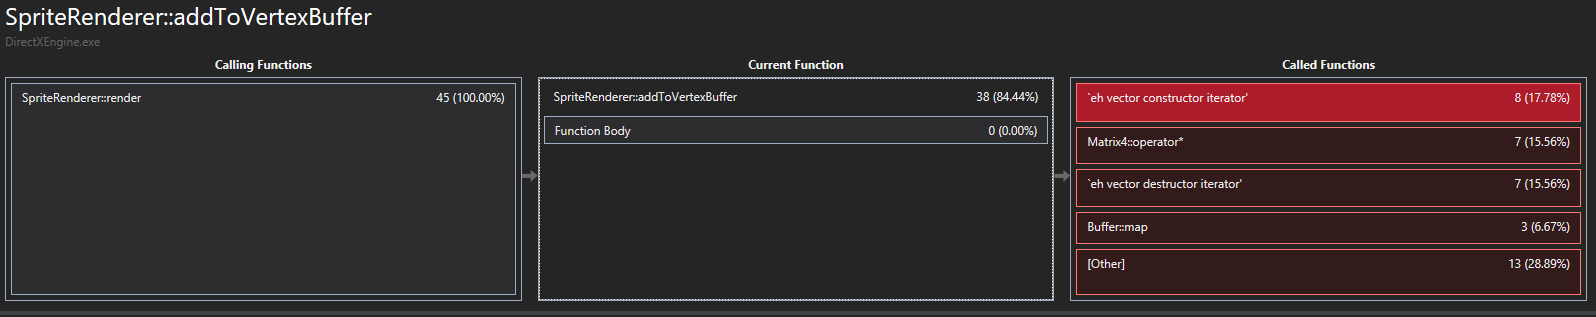
After this most of my time is spent doing the matrix multiplications. By just commenting out the code that does this:


//Pre transform the positions
Matrix4 model = sprite->getModelMatrix();
verts[0].position = model * verts[0].position;
verts[1].position = model * verts[1].position;
verts[2].position = model * verts[2].position;
verts[3].position = model * verts[3].position;
verts[4].position = model * verts[4].position;
verts[5].position = model * verts[5].position;

My SpriteRenderer::render method time drops down to ~30ms. So its not crazy great but its still a pretty solid drop. So using a index buffer to cut out 2 of those pre-transformations might help too. Also sprite->getModelMatrix() under the hood is really doing transform * rotation * scale. So thats another set of matrix multiplications. I wonder if I should just recreate the matrix based on position, rotation, and scale vectors as it might be less math in the end

3 hours ago, Zaoshi Kaba said:

Am I understanding this correctly: your renderList contains 10,000 sprites and you Map() > memcpy() > Unmap() each one individually? No wonder you're having issues. It should be a single Map() > memcpy() > Unmap() call.

You are looking at that correctly and I 100% agree. I have actually done a quick test, where I place everything into a normal array first and then do a Map() > memcpy() from the normal array to the vertex buffer > Unmap() only when I am about to do a Draw call. By doing this it makes my SpriteRenderer::render method drop down to only taking ~25ms. Definitely a change that I need to make

51 minutes ago, Infinisearch said:

This is a much better way of doing things rather than mapping and unmapping 10,000 times.  But 25ms still seems to much for what you're doing.

Are you creating 10,000 * 6 sprite vertex's per frame invidually?  Or up front?  60,000 dynamic memory allocations a frame might slow you down especially on a laptop CPU.

What does flushvertexbuffer do exactly?

Oh no, the sprites are all created at the beginning of the application's start and added to the render list. Once that is done thats it. Nothing is added or removed during the test.

flushVertexBuffer is where my Draw call takes place. It basically updates the constant buffer for the MVP matrix and the does the draw call. Drawing as much data as I need (which in this case is all 10K sprites). Then any counters needed to determine where we are in the buffer or where to draw from, or etc are updated/reset


Sorry for the post walls, just trying to cover everything :)

14 hours ago, noodleBowl said:

flushVertexBuffer is where my Draw call takes place. It basically updates the constant buffer for the MVP matrix and the does the draw call. Drawing as much data as I need (which in this case is all 10K sprites). Then any counters needed to determine where we are in the buffer or where to draw from, or etc are updated/reset

Half of that sentence is very suspicious. Could you show code for your flushVertexBuffer method? Or even better - upload all code in .zip (if possible), it's somewhat hard to track things when it's all over the place.

I see that addToVertexBuffer(Sprite* sprite) also creates geometry for sprites every frame. Most of the time that's not the right way to do it and it probably still uses majority of your CPU.

On 12/8/2017 at 12:18 AM, noodleBowl said:

The 40ms time is just the cost of doing the render, so this is just the Draw and unmap/map calls. When I time this function I'm doing it like so:

That should just be the CPU side of the equation... but if you're getting 40 or even 25ms for that you should focus your efforts into the CPU side.

I'd like to see your flushvertexbuffer method as well.

-potential energy is easily made kinetic-

 So here is the code for the sprite renderer in full.

5 hours ago, Zaoshi Kaba said:

Half of that sentence is very suspicious. Could you show code for your flushVertexBuffer method?

2 hours ago, Infinisearch said:

That should just be the CPU side of the equation... but if you're getting 40 or even 25ms for that you should focus your efforts into the CPU side.

I'd like to see your flushvertexbuffer method as well.

Here is the code for my Sprite Renderer. Also here is a quick look at the  flushvertexbuffer


void SpriteRenderer::flushVertexBuffer()
{
    if (vertexCountToDraw == 0)
        return;
 
    D3D11_MAPPED_SUBRESOURCE resource = mvpConstBuffer->map(D3D11_MAP_WRITE_DISCARD);
    memcpy(resource.pData, projectionMatrix.getData(), sizeof(Matrix4));
    mvpConstBuffer->unmap();
 
    //Draw the sprites that we need to
    graphicsDevice->getDeviceContext()->Draw(vertexCountToDraw, vertexCountDrawnOffset);
    vertexCountDrawnOffset += vertexCountToDraw;
    vertexCountToDraw = 0;
 
    ++drawCallCount;
 
}
5 hours ago, Zaoshi Kaba said:

I see that addToVertexBuffer(Sprite* sprite) also creates geometry for sprites every frame. Most of the time that's not the right way to do it and it probably still uses majority of your CPU.

I agree with this. Most of my CPU crunching comes from this method. Based on the performance tests done with the profiler in visual studio and manually confirming it this seems to be the case

I'm not really sure how dynamic sprites should be handled other then this way. I have thought about having the sprite data be precomuted in the Sprite class  itself and then only updated when its needed. Then my addToVertexBuffer(Sprite* sprite) method would just becomes a simple copy method to place the sprites that should display into the vertex buffer

Advertisement

Generating 10k sprites per frame should be feasible at fairly low performance cost. I've worked on games where we generated dozens of entire player models (10k verts each) per frame on the CPU and streamed them to the GPU.

On 09/12/2017 at 7:21 AM, noodleBowl said:

I have actually done a quick test, where I place everything into a normal array first and then do a Map() > memcpy() from the normal array to the vertex buffer > Unmap() only when I am about to do a Draw call. By doing this it makes my SpriteRenderer::render method drop down to only taking ~25ms.

25ms is still massive :o Do some more timing to measure each individual step.

Do you by chance have any of the iterator debug features of std::vector enabled? Iterating standard contains can be horribly slow when you do.

So I went back and did some refactoring. Changes:

  • Setup an index buffer that is flagged immutable and is filled at the renderer's init
  • Reduced the number of vertex calculations I have to do because of the index buffer usage
  • I moved my mvpConstBuffer map/unmap to only do at the start of my SpriteRenderer::render method
  • I only a map/unmap my vertex buffer once per Draw call instead of every time I add a sprite

Current render time for doing 10K 64x64 textured sprites over 2 Draw calls (I limited the vertex buffer to only hold 5K worth of sprite data) is ~22.5ms. So its a improvement, but still not that great

23 hours ago, Hodgman said:

Do you by chance have any of the iterator debug features of std::vector enabled? Iterating standard contains can be horribly slow when you do.

Didn't even know this was a thing. According to the MSDN docs this is enabled by default for debug mode. For some reason I can't get it to shutoff (assuming its on still). I tried putting _ITERATOR_DEBUG_LEVEL 0 in the preprocessor settings of my visual studio project properties, but it seems to make no difference for debug build. If I try putting it at the top of my main .CPP I get conflicting errors where it says _ITERATOR_DEBUG_LEVEL 0 does not match _ITERATOR_DEBUG_LEVEL 2 for ****.obj

Regardless, running in Debug Mode I get the ~22.5ms for 10K sprites. Running in Release Mode I get ~1.5ms - ~4.3ms for 10K sprites. If I bump up the sprite count to 125K for Release Mode my render method time is ~19.8ms - ~24.75ms

Even when I look the Release Mode numbers I still think thats pretty low...

23 hours ago, Hodgman said:

25ms is still massive  Do some more timing to measure each individual step.

I went back and starting timing each step like you said and this is when I'm looking at:

For 10K sprites. Debug mode

Render method: ~22.5ms
addSpriteToVertexBuffer: ~0.002053 per sprite. Total time for the 10K: ~20.53ms
Setting the sprite data/vertices (Done inside addSpriteToVertexBuffer): ~0.000411ms per sprite. Total time for the 10K: ~4.11ms

Spoiler


//Set up the vertex data for the sprite
float textureWidth = (float)spriteTexture->getWidth();
float textureHeight = (float)spriteTexture->getHeight();
float width = textureWidth / 2.0f;
float height = textureHeight / 2.0f;
spriteVertexData[vertexCountInBuffer].position.setXYZ(-width, -height, 0.0f);
spriteVertexData[vertexCountInBuffer + 1].position.setXYZ(width, height, 0.0f);
spriteVertexData[vertexCountInBuffer + 2].position.setXYZ(width, -height, 0.0f);
spriteVertexData[vertexCountInBuffer + 3].position.setXYZ(-width, height, 0.0f);

float u = 0.0f;
float v = 0.0f;
float uWidth = 1.0f;
float vHeight = 1.0f;
spriteVertexData[vertexCountInBuffer].texCoords.setXY(u, vHeight);
spriteVertexData[vertexCountInBuffer + 1].texCoords.setXY(uWidth, v);
spriteVertexData[vertexCountInBuffer + 2].texCoords.setXY(uWidth, vHeight);
spriteVertexData[vertexCountInBuffer + 3].texCoords.setXY(u, v);

spriteVertexData[vertexCountInBuffer].color.setRGB(0.0f, 0.0f, 0.0f);
spriteVertexData[vertexCountInBuffer + 1].color.setRGB(0.0f, 0.0f, 0.0f);
spriteVertexData[vertexCountInBuffer + 2].color.setRGB(0.0f, 0.0f, 0.0f);
spriteVertexData[vertexCountInBuffer + 3].color.setRGB(0.0f, 0.0f, 0.0f);


Matrix matrix calculations (Done inside addSpriteToVertexBuffer): ~0.001232 per sprite. Total time for the 10K: ~12.32ms

Spoiler


//Matrix calculations
Matrix4 model = sprite->getModelMatrix(); //returns a matrix that is translation * rotation * scale
spriteVertexData[vertexCountInBuffer].position = model * spriteVertexData[vertexCountInBuffer].position;
spriteVertexData[vertexCountInBuffer + 1].position = model * spriteVertexData[vertexCountInBuffer + 1].position;
spriteVertexData[vertexCountInBuffer + 2].position = model * spriteVertexData[vertexCountInBuffer + 2].position;
spriteVertexData[vertexCountInBuffer + 3].position = model * spriteVertexData[vertexCountInBuffer + 3].position;
QueryPerformanceCounter(&endTime);

//getModelMatrix Method
Matrix4 SpriteV2::getModelMatrix()
{
	return translationMatrix * rotationMatrix * scaleMatrix;
}


A decent chunk of my time is spent doing Matrix calculations, but I really don't know how I can get the timing down on those. The profiler that comes with visual studio seems to back this up too. Just in case anyone is curious here are the profiler's reports: 10KSpritesPerfReports.zip


I also noticed something kind of weird while timing the individual steps. For example when timing the matrix calculation block my application's window would be blank. Not blank like I saw the clear color, but blank like I only saw the window background. Once all my debug statements were done printing I saw my sprites. I think this has something to do with the way that I am printing out the debug statements. Currently I'm allocating a console at the start of the application, so I have the Win32 app and then I have a traditional console, then to print any debug statements I just do


std::cout << myDebugStatementAsString << std::endl;

So it got me thinking, could this also be crippling everything? How should I normally print out debug information? Trying to grasp at anything here

30 minutes ago, noodleBowl said:

A decent chunk of my time is spent doing Matrix calculations, but I really don't know how I can get the timing down on those.

Are you using SIMD math?  Moreover are you using DirectXMath?

https://github.com/Microsoft/DirectXMath

https://msdn.microsoft.com/en-us/library/windows/desktop/hh437833(v=vs.85).aspx

-potential energy is easily made kinetic-

9 hours ago, Infinisearch said:

I'm not using DirectXMath and my system currently does not use SIMD

BUT I did go back and I made a SIMD test. Where I timed multiplying a Matrix4x4 by a Vector3 using SIMD operations and then timed the same thing using normal math operations. I tried to mimic what my 10K Sprite test is doing, so I run the Matrix4x4 * Vector3 operation 4 times and then repeat this 10K times.

The weird thing is the SIMD method runs a little slower then the normal math operations. I really would have thought it would have been the other way around.


Test Results:

//Debug Mode
SIMD TIME: 5.204931ms
NORM TIME: 4.222079ms

//Release Mode
SIMD TIME: 0.300521ms
NORM TIME: 0.242634ms


This is my complete test:

Spoiler


#include <iostream>
#include <memory>
#include <pmmintrin.h>
#include <Windows.h>
#include <string>

class Vector3 
{

public:
	Vector3()
	{
		x = 0.0f;
		y = 0.0f;
		z = 0.0f;
	}

	~Vector3()
	{
	}

	float x;
	float y;
	float z;
};

class Matrix4
{

public:
	Matrix4()
	{
		data[0] = 1.0f;
		data[1] = 0.0f;
		data[2] = 0.0f;
		data[3] = 0.0f;

		data[4] = 0.0f;
		data[5] = 1.0f;
		data[6] = 0.0f;
		data[7] = 0.0f;

		data[8] = 0.0f;
		data[9] = 0.0f;
		data[10] = 1.0f;
		data[11] = 0.0f;

		data[12] = 0.0f;
		data[13] = 0.0f;
		data[14] = 0.0f;
		data[15] = 1.0f;
	}
	~Matrix4() {}

	float data[16];

};

Vector3 normMul(const Matrix4& m, const Vector3 &b)
{

	Vector3 r;
	r.x = m.data[0] * b.x + m.data[4] * b.y + m.data[8]  * b.z + m.data[12] * 1.0f;
	r.y = m.data[1] * b.x + m.data[5] * b.y + m.data[9]  * b.z + m.data[13] * 1.0f;
	r.z = m.data[2] * b.x + m.data[6] * b.y + m.data[10] * b.z + m.data[14] * 1.0f;

	return r;
}

Vector3 simdMul(const Matrix4& m, const Vector3 &b)
{

	//Setup
	Vector3 r;
	__m128 m1 = _mm_set_ps(m.data[12], m.data[8], m.data[4], m.data[0]);
	__m128 m2 = _mm_set_ps(m.data[13], m.data[9], m.data[5], m.data[1]);
	__m128 m3 = _mm_set_ps(m.data[14], m.data[10], m.data[6], m.data[2]);
	__m128 vec = _mm_set_ps(1.0f, b.z, b.y, b.x);

	//Multiple the vecs with the columns; Matrices are column order
	m1 = _mm_mul_ps(m1, vec);
	m2 = _mm_mul_ps(m2, vec);
	m3 = _mm_mul_ps(m3, vec);

	//Get result x
	m1 = _mm_hadd_ps(m1, m1);
	r.x = _mm_cvtss_f32(_mm_hadd_ps(m1, m1));

	//Get result y
	m2 = _mm_hadd_ps(m2, m2);
	r.y = _mm_cvtss_f32(_mm_hadd_ps(m2, m2));

	//Get result z
	m3 = _mm_hadd_ps(m3, m3);
	r.z = _mm_cvtss_f32(_mm_hadd_ps(m3, m3));

	return r;
}

int main()
{

	LARGE_INTEGER startTime;
	LARGE_INTEGER endTime;
	LARGE_INTEGER frq;
	QueryPerformanceFrequency(&frq);

	Vector3 result;
	Matrix4 mat1;
	Vector3 v1;
	v1.x = 2.0f;
	v1.y = 5.0f;
	v1.z = 10.0f;
	QueryPerformanceCounter(&startTime);
	for (int i = 0; i < 10000; ++i)
	{
		for (int j = 0; j < 4; ++j)
		{
			result = simdMul(mat1, v1);
		}
	}
	QueryPerformanceCounter(&endTime);
	std::cout << "SIMD TIME: " + std::to_string((double)((endTime.QuadPart - startTime.QuadPart) * 1000) / (double)frq.QuadPart) + "ms" << std::endl;

	Matrix4 mat2;
	Vector3 v2;
	v2.x = 2.0f;
	v2.y = 5.0f;
	v2.z = 10.0f;
	QueryPerformanceCounter(&startTime);
	for (int i = 0; i < 10000; ++i)
	{
		for (int j = 0; j < 4; ++j)
		{
			result = normMul(mat2, v2);
		}
	}
	QueryPerformanceCounter(&endTime);
	std::cout << "NORM TIME: " + std::to_string((double)((endTime.QuadPart - startTime.QuadPart) * 1000) / (double)frq.QuadPart) + "ms" << std::endl;

	std::cout << "Complete" << std::endl;
}


This topic is closed to new replies.

Advertisement