Advertisement

Compute shader being replaced.

Started by August 25, 2017 04:20 PM
7 comments, last by piluve 7 years, 5 months ago

Hello once again,

I'm performing a bunch of Dispatch() calls but I'm not getting the correct result out of them. I used the VS GraphicsDebuffer , and for some reason, the compute shader of each of the Dispatch call  is the same!

So If I have:


// mat1, mat2 and mat3 have different PSO and RootSignatures
renderPlarform->ApplyMaterial(mat1);
renderPlatform->Dispath(...);

renderPlarform->ApplyMaterial(mat2);
renderPlatform->Dispath(...);  // <- using mat1 compute shader!

renderPlarform->ApplyMaterial(mat3);
renderPlatform->Dispath(...);  // <- using mat1 compute shader!

Could anyone shed some light on this problem? 

I wan't to add a question that may be related with this problem. I'm using this "problematic dispatches" to write to a Resource. So each Dispatch will take a few SRV as inputs and will write to an UAV. Following Dispatches will take the resultant UAV as input (SRV).


Texture FooTex1, FooTex2;
Texture Mat1Out,Mat2Out;

// mat1
Inputs:  (SRV)FooTex1, (SRV)FooTex2
Outputs: (UAV) Mat1Out

// mat2
Inputs:  (SRV)FooTex1, (SRV)FooTex2, (SRV) Mat1Out
Outputs: (UAV) Mat2Out
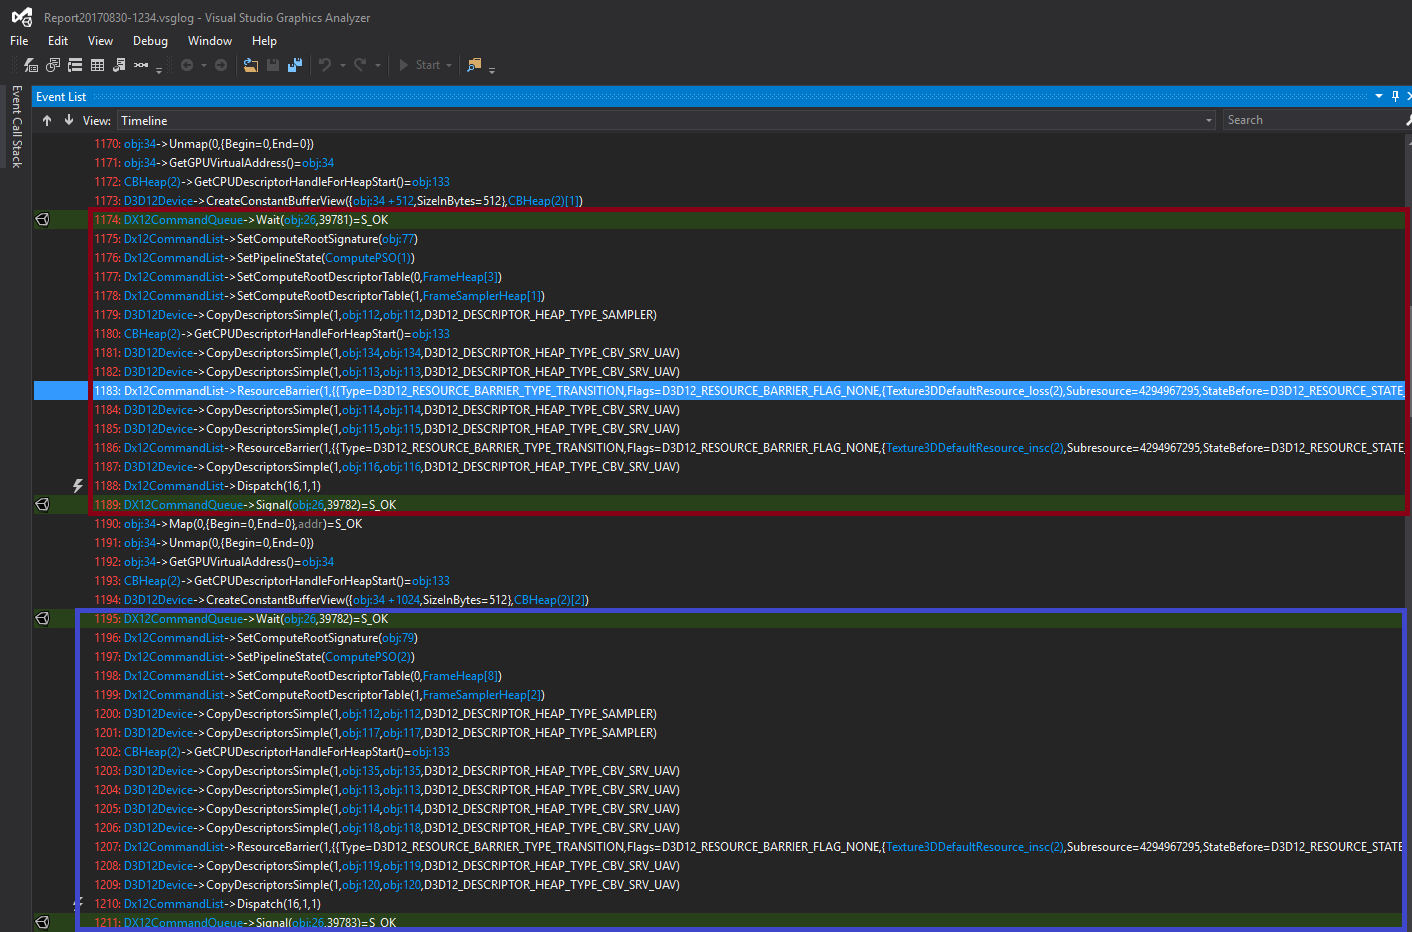
  
// etc.

Currently I'm adding (transition) barriers between UAV<->SRV.

Should I add (uav) barriers to make sure writing to the UAV is done? As far as I understand from the MSDN Doc , "all unordered access view (UAV) accesses (reads or writes) must complete before any future UAV accesses (read or write) can begin" I don't need it as I'm not doing further UAV read/write.


Thanks :D 


I would try capturing your program with another debugging tool to see if they match what the VS graphics debugger is telling you. RenderDoc now has D3D12 support, and there's also the new PIX for Windows (both of which are better than the VS graphics debugger IMO). If they also tell you that the compute shader isn't changing when you switch PSO's, then I would double-check your code for creating those PSO's to make sure that you're passing the right bytecode.

As for your barrier question, if you're already issuing a barrier to transition Mat1Out from UAV->SRV then you don't need any additional barriers. You only need UAV barrier in the case where 1 draw/dispatch writes to a resource through a UAV, and a second draw/dispatch will read from that resource using a UAV descriptor, or if you want ensure that the writes from the second draw/dispatch all happen after the writes from the first draw/dispatch. With no barrier, you have no guarantee that the threads from the first draw/dispatch will occur before the threads from the second draw/dispatch start running, and in fact it's very likely they will overlap to some extent on most GPU's. 

Advertisement

Hi @MJP, I´m using the VS Debugger because it is the only one that seems to work fine with DX11on12. I´ll check out the new release of RenderDoc (I think I have an older version).

Thanks for clarifying the UAV barriers, the doc is a bit confusing in that aspect :c

Don't forget the trusty Debug Layer. I trust you're running 'clean' with no Warnings or Errors with that enabled?

Adam Miles - Principal Software Development Engineer - Microsoft Xbox Advanced Technology Group

Hi @ajmiles, yeah I have it enabled and quiet at the moment :) 

I've been investigating this issue again and I think I'm missing some kind of synchronisation. If I leave the first shader as it is and replace the second with a dummy one that just outputs a colour, I see that the second Dispatch now has the appropriate compute shader. 

Maybe I need to do some some kind of GPU-GPU synchronisation? Does the UAV->SRV barrier stall the hole compute dispatch or only the access of the resource? 

I'm running out of ideas :(  

EDIT:

Maybe this pic helps:

computeproblem.thumb.png.1a982471241834786a0891a20a0615f9.png

I added a Wait/Signal block to discard any issues related with synchronisation. 

Advertisement

I did some cleaning to the rendering code as I had a lot of remaining DX11on12 code and now I'm able to debug using PIX and NVIDIA Nsight. As far as I can see, it looks like the compute shaders are in place as they should but looks like one SRV is invalid. I have to play around with PIX because I've never used it, so far looks much better than the VSGraphics Debugger :) 

I just wanted to give an update on this problem.

I finally solved the issue. First, as I said in my previous comment, I removed all the remaining dx11on12 which was causing PIX and NSight to crash. After that I did some debugging and realised that our rendering API can expect a NULL resource to be set (and I was ignoring it) this caused many problems with the bindings etc. Right now, instead of using null descriptors, I'm setting a dummy texture of size 1 (which seems to work fine). I also found another bug that was affecting the hole thing. During RootSignature creation, the resources are added in order to the signature, but during the binding I was setting them in a wrong order sometimes.

And that was it for this bug.

Thanks!

This topic is closed to new replies.

Advertisement