In this article by Lesley Harrison, author of TortoiseSVN 1.7, we shall:
- Explore working with revision graphs
- Learn how to change views in revision graphs
- Learn how to prune trees to make the revision graph easier to understand
Revision graphs provide an easy way for you to tell at-a-glance what is going on with your project. They provide a map, in easy-to-understand tree form, of the revision history of your project, including copies, branches, and tags.
One useful feature of revision graphs is that you can export them into a vector graphics format (WMF is a good option because they scale well and produce fairly small file size images. If you need a more widely supported format, then PNG is a good option) for inclusion with your source code, or on your project's website, giving everyone an easy overview of the status of your project.
You can view revision graphs for files, directories, or the whole project.Time for action - viewing a revision graph
- To view a revision graph, go to your working copy, and right-click inside the project, and then select TortoiseSVN | Revision Graph.
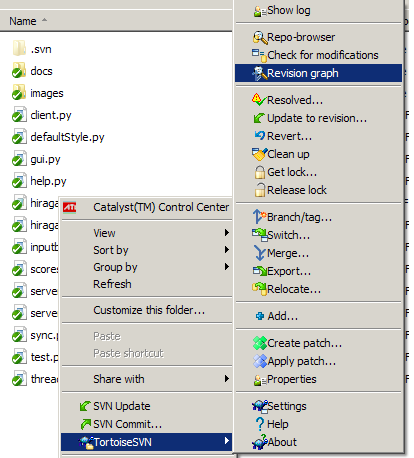
- The graph that appears in the following screenshot shows the history of any branches and tags created, in an easy-to-understand, tree-like structure:
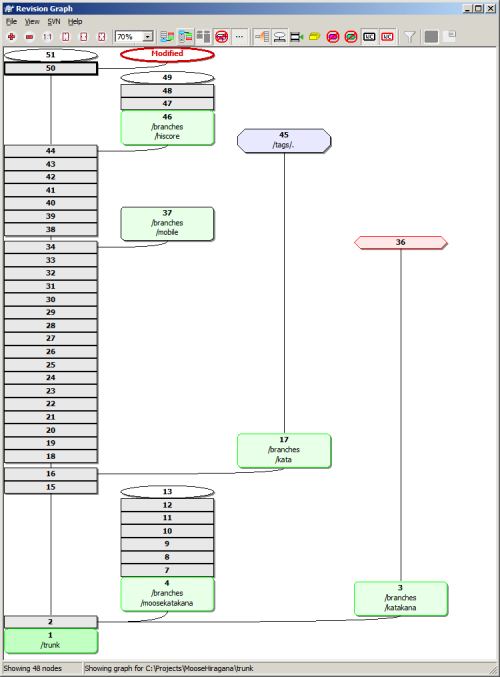
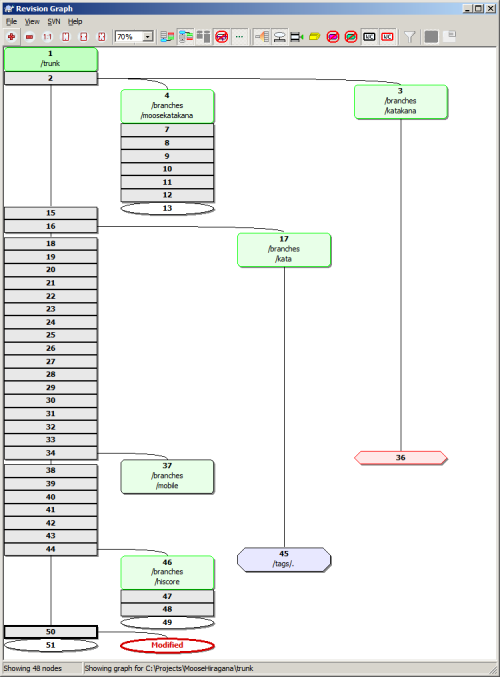
- If you prefer to read from top to bottom, rather than having the newest node at the top of the screen, then click the Show oldest node at top button (this can be found two buttons to the right of the drop-down which allows you to change the zoom level). This will invert the view, as shown in the following screenshot:
- You can view information about a particular branch by right-clicking on it and selecting Show Log:
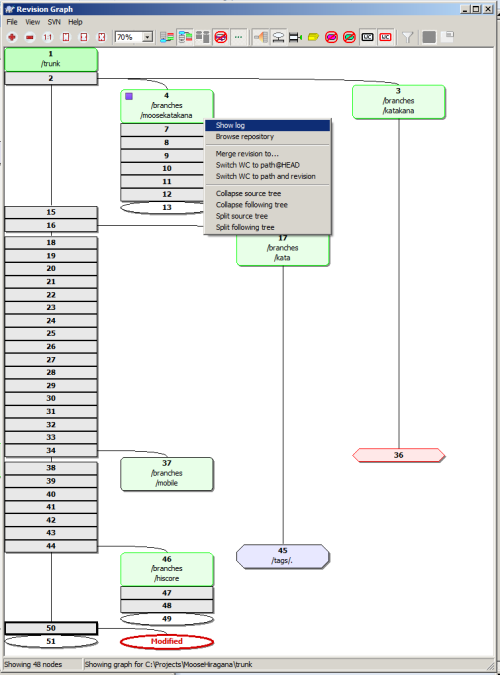
- You can also use the same context menu to merge revisions, switch your working copy to a particular branch or tag, browse the repository, and collapse trees.
- To view a revision graph, go to your working copy, and right-click inside the project, and then select TortoiseSVN | Revision Graph.
- Group by Branch: This option is off by default, so all rows are sorted by revision. This can be a problem if you have branches with a long life and a few commits, because those branches will occupy a whole column, making the graph expand unnecessarily. This is demonstrated in the following screenshot:
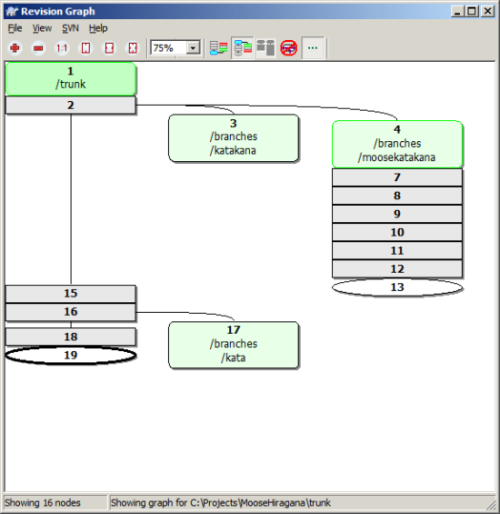
Turning on Group by Branch will change this so that revisions on a branch will be shown on consecutive lines, and branches will be grouped into columns, keeping the graph slim. The previous screenshot shows the default appearance of the revision graph (a shorter revision graph has been used here, for ease of viewing), the next screenshot shows the same revision graph with Group by Branch: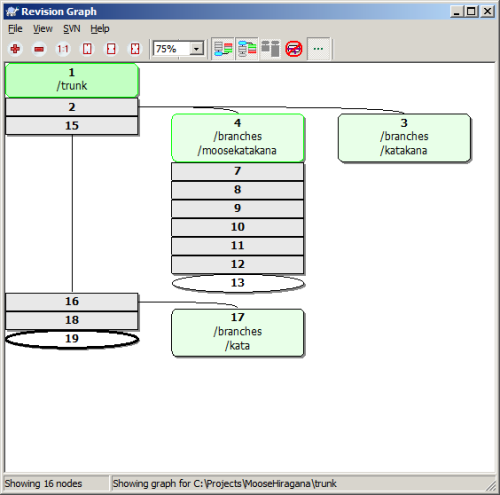
With this fairly simple tree layout, the difference isn't immediately clear, but if you have a lot of branches, you'll find that the group by branch feature keeps the layout much neater, and avoids needless scrolling. - Oldest on top: This option switches the graph so that the oldest revisions are shown at the top of the screen. By default, the oldest revisions are at the bottom, and the 'tree' grows upwards.
- Align trees on top: This option forces trees to grow down, rather than appearing in their natural revision order, or aligned at the bottom of the window.
- Reduce cross lines: This option cleans up the revision graph if there are lots of crossing lines. In some cases, this option can make the layout appear less logical, and can also make the graph take up a larger area of the screen.
- Differential path names: This option makes the path names in the node boxes as short as possible--so if you create a branch called /branches/katakana/images/characters out of /trunk/images/characters, the branch would be shown as merely /branches/katakana/.. the remainder of the path has not changed.
- Exact copy sources: The default behavior of the revision graph is to show branches as being taken from the last node where the change was made. In practice, many people make branches from the HEAD rather than from a specific revision. If you have a reason for needing to know which revision was used to create a copy, then you can use this option to show those details.
- Fold tags: If your project has a lot of tags, then you may find that they take up unnecessary screen space, hiding the information that you are interested in. You can use this option to hide the nodes for tags. If you still need to find a tag, you will find them displayed as tooltips on the node that they were copied from. Each source node that had a tag made from it will have an icon on the right-hand side indicating that a tag was made.
- Tree stripes: No, this option isn't related to landscape gardening. The tree stripes option tells TortoiseSVN to use alternating background colors so that it is easy to distinguish between different trees in the graph.
[indent=1]Keeping your view up-to-date
If you are viewing a revision graph of an active project, you may want to check for updates. Just as you would in your web browser, you can refresh the revision graph by pressing F5. This will connect you to the server (if you have been working offline) and check to see if there have been any new commits. Pressing F5 to refresh works for most screens in TortoiseSVN. You can update your log dialog, for example, by pressing F5 too.Pruning trees
Large software projects can end up with lots of trees. This can make the revision graph look excessively complex, and can make it harder for you to find the information that you need. The good news is that you can tame the trees in your graph, shrinking and expanding them as you need them.
To shrink a tree or a branch, simply hover your mouse over the point where the branch begins (where the node link enters the node), and you will be given the option to collapse the related tree (-), or expand it (+). If applicable, you will also be presented with the option to split a sub-tree into a separate graph (x), or re-attach a tree that had been split (o):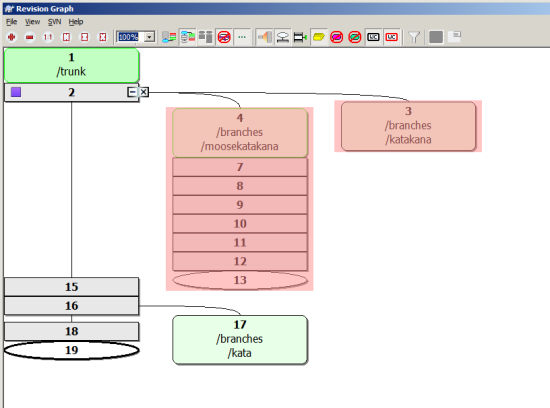
Summary
In this article you learned how to view revision graphs, and how to manipulate your view of the graph to give a clearer view of the things that you are interested in.
Revision graphs are useful for even small development teams. The good thing about the way TortoiseSVN displays them is that they are highly customizable, and scale well for larger projects. So, if you need to keep up with the lifecycle of branches and tags in a big project, then you can do so easily--thanks to the highly customizable views offered by TortoiseSVN!
What just happened?
You have just used the revision graph to get an overview of the revisions, branches, and tags in your project. The last revision graph that we saw is a simple one, taken from our example project. In a real-world scenario, it is likely that the revision graph would be much more complex, and it is in these complex projects that having a revision graph becomes so useful.
When there are dozens of branches which are being created and merged, it can become difficult to keep track of what happened when, and why. A revision graph gives you a clear high-level view of everything that is happening in your software project.
To fully understand the revision graph, it helps to understand what each node means. The following table will help with this:
Items which have been added or copied Branch HEAD revisions (if you have elected to show these) Plain with bold outline (a red outline indicates modifications)
You can use the graph to get more detailed information about the differences between revisions. Just Ctrl-click on the two revisions you are interested in, right-click to bring up the context-sensitive menu, and then select Compare Revisions. You will be able to see a list of the revisions made to each file. Compare them using TortoiseDiff, as shown in the following screenshot:
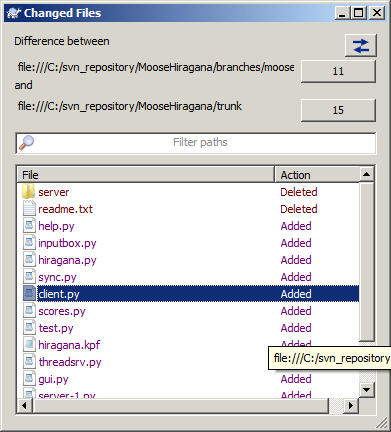
You can also compare HEAD revisions, and view the unified differences using this method.


