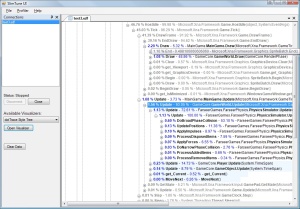
Generally speaking, profilers operate in one of two modes: sampling (statistical), and tracing (instrumenting). Sampling operates by suspending the process at high frequency and examining the program state. It converges to a decent overview of where your code is spending time, but it doesn't produce meaningful timing information. The frequency simply isn't high enough. Tracing injects calls to the profiler every time a function is entered or exited, allowing it to monitor the complete progression of your code. You get accurate results with fairly reliable timings, but it's incredibly slow. (Oh, and it crashes dotTrace. People pay for this?)
I've been looking at doing a hybrid mode since the beginning of the project; I finally came up with a concrete approach when a friend gave me a rough overview of SN Tuner, the profiler for the PS3. The idea is fairly simple: you don't generally want tracing-level accuracy for the vast majority of the code. All you really need is an overview, which sampling does a good job of, and then tracing when you're focusing on one specific piece. You also don't really need detailed profiling of framework code (everything in System, for example). Although I'm still working on the front-end, SlimTune is now able to do this type of selective instrumentation at runtime.
Using it is pretty simple. When you start up the target, select Hybrid in the SlimTune UI. This will cause the program to run in sampling mode, and you'll get your overview results. Then, you can select a function from the overview and ask it to be traced, and then results will flow in from that function and its children only. You can also turn it off again, and you can ask for entire namespaces to be skipped in either tracing or hybrid mode. Hybrid mode is a little slower than sampling overall, but it allows you to get very detailed results without the huge performance hit that normally accompanies that level of detail.
Internally, it's a little tricky to pull this off but it's not too bad. I discovered early on that taking a lock on the function hooks is hideously expensive, even at zero contention. I use a few lockfree tricks to get the necessary data much faster. It's also very important not to let the sampling profiler attempt to sample inside the hooks, as this leads to some nasty deadlocks; again, lockfree code is used to lay out some unsafe zones that the sampler can detect and avoid. SuspendThread is one messy son of a bitch.
So there are at least three features I'm giving you for free which a five hundred dollar competitor doesn't have. Sure they have a much cleaner interface, VS integration, memory profiling, and so forth...but I've only been doing this for a month. Kinda makes me wonder. Oh, and guess what I spent the last day or so doing...
